
BIMappy GeoFilter
€ 0,00
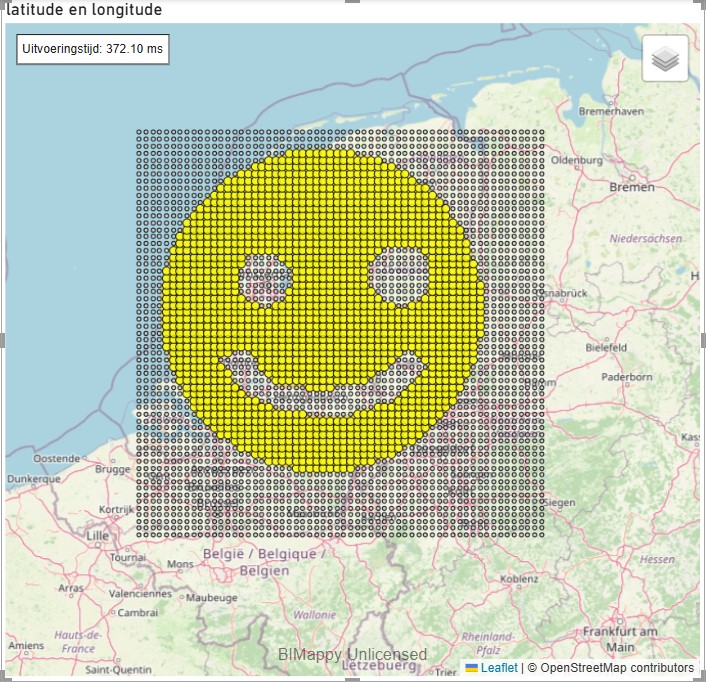
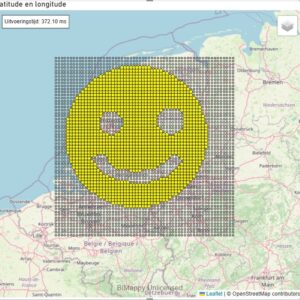
BIMappy GeoFilter is a specialized Power BI custom visual that brings powerful yet straightforward geospatial filtering capabilities to your reports and dashboards. Unlike complex GIS tools that require extensive training, BIMappy GeoFilter focuses on doing one thing exceptionally well: filtering coordinate data based on GeoJSON boundaries.
Description
BIMappy GeoFilter is a specialized Power BI custom visual that brings powerful yet straightforward geospatial filtering capabilities to your reports and dashboards. Unlike complex GIS tools that require extensive training, BIMappy GeoFilter focuses on doing one thing exceptionally well: filtering coordinate data based on GeoJSON boundaries.
Version: 1.1.0.5
Key Features
- Simple Coordinate Mapping: Easily plot latitude and longitude data on an interactive map
- GeoJSON-Based Filtering: Filter your data points by loading any GeoJSON boundary file
- Zoom selection: Filter your data points after GeoJSON filter on zoom level
- One-Click Selection: Apply filtered selections directly to other visuals in your Power BI report
- Visual Differentiation: Clearly distinguish between points inside and outside your boundaries
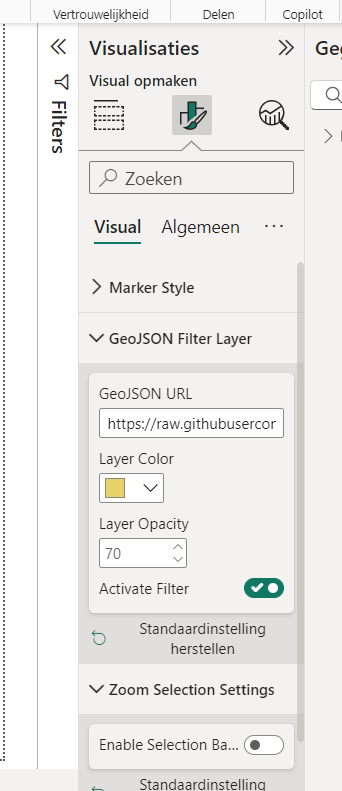
- Customizable Marker Styling: Personalize marker color, size, and opacity
- Responsive Performance: Efficiently handles large datasets with optimized rendering
Perfect For
- Business analysts working with location data who need filtering without GIS expertise
- Organizations mapping customer locations within sales territories or service regions
- Government entities analyzing data within administrative boundaries
- Anyone tracking assets, events, or activities that need to be filtered by geographic areas
How It Works
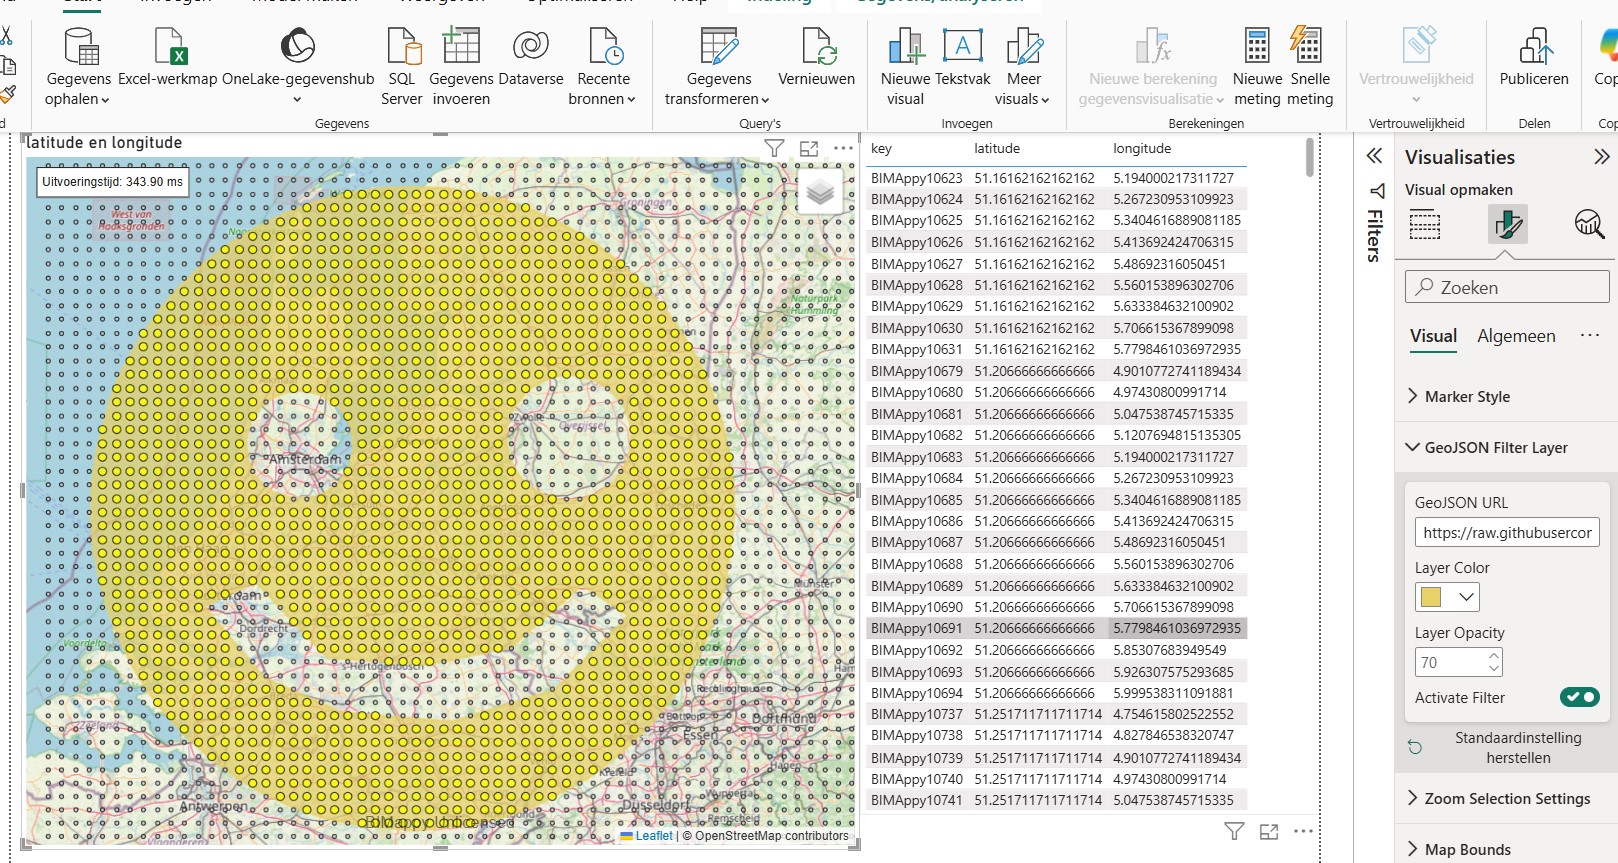
- Add your latitude and longitude columns to the visual
- Enter a GeoJSON URL for your boundary area
- Toggle the filter to select only points within the boundary
- Watch as your other Power BI visuals automatically update based on your selection
Why Choose BIMappy GeoFilter?
While many mapping tools try to do everything, BIMappy Geofilter excels by focusing on a single, essential workflow. This makes it both powerful for experienced users and accessible for those new to geospatial analysis. The visual requires minimal setup and delivers immediate value with its intuitive interface and seamless integration with Power BI’s native filtering capabilities.
Related products
BIMappy GeoFilter Premium license
€ 95,00
BIMappy GeoFilter Premium is a specialized and Mircosoft certified Power BI custom visual that brings powerful yet straightforward geospatial filtering capabilities to your reports and dashboards. Unlike complex GIS tools that require extensive training, BIMappy GeoFilter focuses on doing one thing exceptionally well: filtering coordinate data based on GeoJSON boundaries.
Description
BIMappy GeoFilter Premium is a specialized and Microsoft certified Power BI custom visual that brings powerful yet straightforward geospatial filtering capabilities to your reports and dashboards. Unlike complex GIS tools that require extensive training, BIMappy GeoFilter Premium focuses on doing one thing exceptionally well: filtering coordinate data based on GeoJSON boundaries.
Version: 1.1.0.5
Key Features
- Simple Coordinate Mapping: Easily plot latitude and longitude data on an interactive map
- GeoJSON-Based Filtering: Filter your data points by loading any GeoJSON boundary file
- Zoom selection: Filter your data points after GeoJSON filter on zoom level
- One-Click Selection: Apply filtered selections directly to other visuals in your Power BI report
- Visual Differentiation: Clearly distinguish between points inside and outside your boundaries
- Customizable Marker Styling: Personalize marker color, size, and opacity
- Responsive Performance: Efficiently handles large datasets with optimized rendering
Perfect For
- Business analysts working with location data who need filtering without GIS expertise
- Organizations mapping customer locations within sales territories or service regions
- Government entities analyzing data within administrative boundaries
- Anyone tracking assets, events, or activities that need to be filtered by geographic areas
How It Works
- Add your latitude and longitude columns to the visual
- Enter a GeoJSON URL for your boundary area
- Toggle the filter to select only points within the boundary
- Watch as your other Power BI visuals automatically update based on your selection
Why Choose BIMappy GeoFilter Premium?
While many mapping tools try to do everything, BIMappy Geofilter excels by focusing on a single, essential workflow. This makes it both powerful for experienced users and accessible for those new to geospatial analysis. The visual requires minimal setup and delivers immediate value with its intuitive interface and seamless integration with Power BI’s native filtering capabilities.